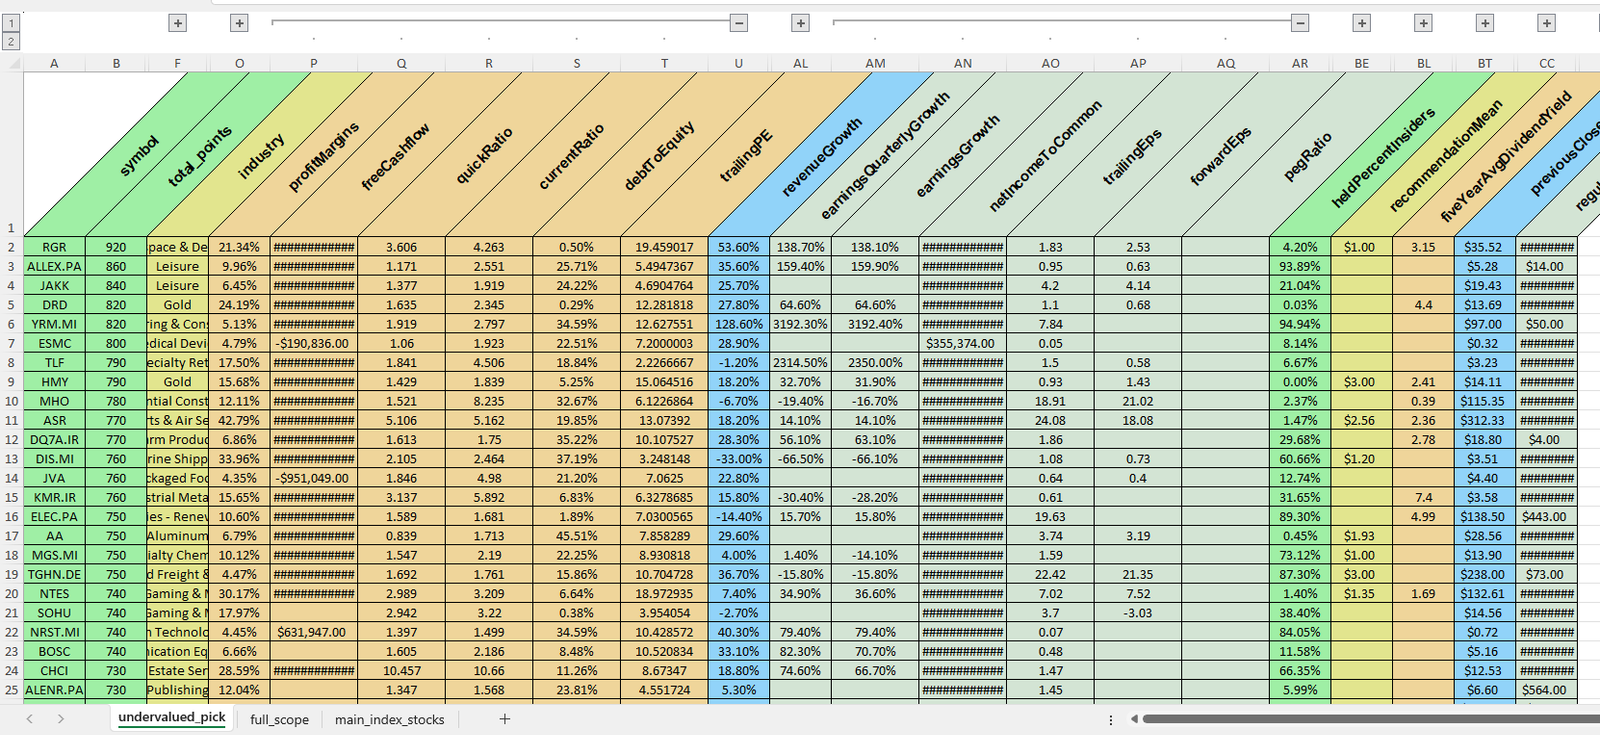
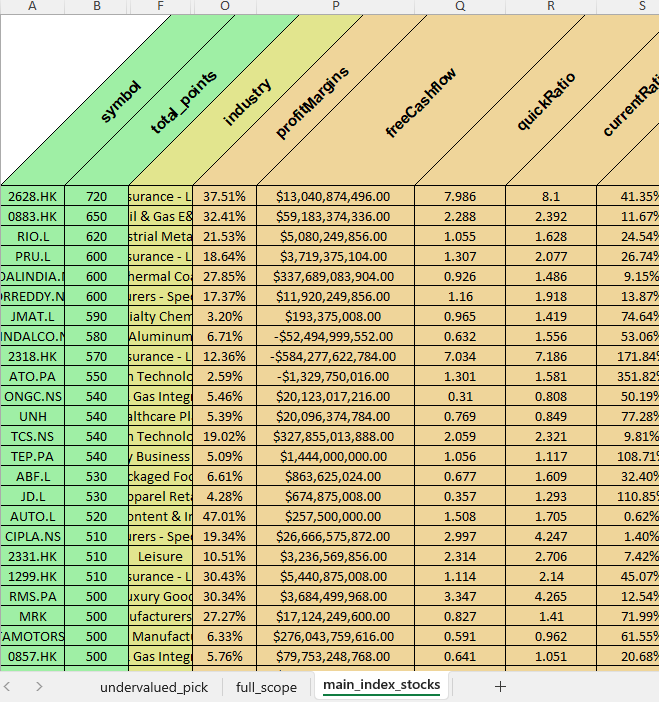
See here our EXAMPLE: Test File – Standard Extract
We search/filter for companies that have:
- Price/Earnings between 1 and 20
- Trailing Earnings per share > 1
- Current ratio > 1.2 (AC/PC)
- Quick ratio > 0.8 (Cash / PC)
- Debt/Equity < 50%
- Price to Sales (last 12 months) between 0.1 and 3
To our list of undervalued stocks we also assign an score (Column: ‘Total Points’) regarding different inputs (you can download the example file from home page).
The score is the result of the sum of all inputs below (WARNING: This is an score to use as a guide, NOT a purchase recommendation. ALWAYS check within the official companies reports before making an investment decision) :
1. QuickRatio Points
- quickRatio > 1.5 = 100 points
- quickRatio between 1 and 1.5 = 80 points
- quickRatio between 0,7 and 1 = 60 points
- quickRatio between 0,6 and 10,7 = 40 points
- quickRatio < 0.6 = 0 points
2. Current Ratio Points
- currentRatio > 2 = 100 points
- currentRatio between 1,6 and 2 = 80 points
- currentRatio between 1,4 and 1,6 = 60 points
- currentRatio between 1,2 and 1,4 = 40 points
- currentRatio < 1,2 = 0 points
Know more: Investopedia – QuickRatio vs CurrentRatio!
3. Price to Sales
- priceToSalesTrailing12Months < 0,8 = 100 points
- priceToSalesTrailing12Months between 0,8 and 1 = 80 points
- priceToSalesTrailing12Months between 1 and 1,1 = 60 points
- priceToSalesTrailing12Months between 1,1 and 1,3 = 40 points
- priceToSalesTrailing12Months > 1,4 = 0 points
Know more: Investopedia – What is a good Price to Sales ratio?
4. Price to Earnings
- trailingPE < 7 = 100 points
- trailingPE between 7 and 10 = 80 points
- trailingPE between 10 and 15 = 60 points
- trailingPE between 15 and 20 = 40 points
Know more: Investopedia – Using P/E and PEG
5. Profit Margins
- profitMargins >15% = 100 points
- profitMargins between 10% and 15% = 80 points
- profitMargins between 5% and 10% = 60 points
- profitMargins < 5% = 0 points
6. Enterprise to Ebitda
- enterpriseToEbitda < 9 = 80 points
- enterpriseToEbitda between 9 and 12 = 50 points
- enterpriseToEbitda between 12 and 16 = 20 points
7. Enterprise to Revenue
- ‘enterpriseToRevenue’ < 0,8 = 80 points
- ‘enterpriseToRevenue’ between 0,8 and 1 = 50 points
- ‘enterpriseToRevenue’ between 1 and 2 = 20 points
8.Return on Assets
- ‘returnOnAssets’ > 20% = 80 points
- ‘returnOnAssets’ between 13% and 10% = 50 points
- ‘returnOnAssets’ between 8% and 13% = 20 points
9. Return on Equity
- ‘returnOnEquity’ > 20% = 80 points
- ‘returnOnEquity’ between 15% and 20% = 50 points
- ‘returnOnEquity’ between 10% and 15% = 20 points
10. Revenue growth YoY
- ‘revenueGrowth’ > 20% = 100 points
- ‘revenueGrowth’ between 15% and 20% = 70 points
- ‘revenueGrowth’ between 7% and 15% = 40 points
Why Focus on Small Cap Stocks in 2025?
Small cap stocks often outperform during periods of economic recovery and innovation. With 2025 poised for technological disruption and sector rotations, targeting low-priced small caps with solid fundamentals can be a winning strategy.
These stocks tend to be undervalued by institutional investors and offer greater price appreciation potential when market sentiment shifts in their favor.
What’s Included in Our Excel List of Undervalued Stocks
- Company name and ticker
- Market capitalization and sector breakdown
- Valuation metrics: P/E, EV/EBITDA, Price/Sales
- Growth indicators: revenue, earnings, profit margins
- Risk indicators: debt ratios, cash flow trends
Everything is neatly compiled into an easy-to-use Excel format that can be filtered and sorted to match your specific investment criteria.
To know more about us: Tango Finance – Home Page.
We continue to develop reliable models to bring you the best possible list of undervalued stocks with great potential growth opportunities. Don’t hesitate to contact us!


Peter C. –
Great information! Since a while I was searching for something like this. A nice extract for those who wants to identify potential undervalued stocks but not the mean to do it.
tango_finance –
Thanks, dont hesitate to come back to us in case of any doubt!
Issakha –
Great tool for anyone looking for an efficient way to obtain relevant information.
News –
This is a very useful resource for identifying undervalued stocks with growth potential. The scoring system seems well thought out and easy to understand. I appreciate the option to download the example file for further analysis. It’s great to see a tool that simplifies the process for investors. How often is the list of undervalued stocks updated? Given the growing economic instability due to the events in the Middle East, many businesses are looking for guaranteed fast and secure payment solutions. Recently, I came across LiberSave (LS) — they promise instant bank transfers with no chargebacks or card verification. It says integration takes 5 minutes and is already being tested in Israel and the UAE. Has anyone actually checked how this works in crisis conditions?
igengroba (verified owner) –
Hello! Glad that you found the tool useful. Last update is from yesterday (26/06/2025). Don’t hesitate to contact us ‘tango.solutions.it@gmail.com’. Kind regards, Tango team
German news –
This is a very useful tool for identifying undervalued stocks with growth potential. The scoring system and downloadable example file make it easy to understand and use. It’s great to see continuous development of reliable models to improve the list. I appreciate the team’s responsiveness and willingness to assist. How often is the list updated to ensure the information remains current? German news in Russian (новости Германии)— quirky, bold, and hypnotically captivating. Like a telegram from a parallel Europe. Care to take a peek?